With Arctic ice having reached its September minimum, it is time for the annual update. My figures come from NSIDC https://nsidc.org/arcticseaicenews/
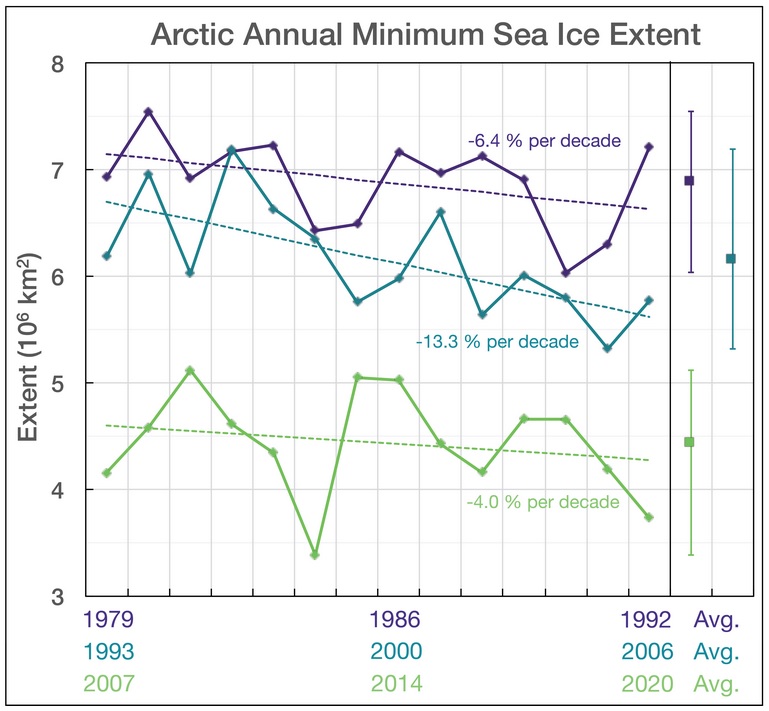
The last fourteen (14) years show the lowest annual arctic sea ice minima in the satellite record (ie since 1979). The trend over these years 2007 – 2020 is -0.4% per annum. That seems to me to be as close to flat as makes no difference, but you may differ.
Figures for annual minima are:
| Year | m Km2 |
| 2007 | 4.16 |
| 2008 | 4.59 |
| 2009 | 5.12 |
| 2010 | 4.62 |
| 2011 | 4.34 |
| 2012 | 3.39 |
| 2013 | 5.05 |
| 2014 | 5.03 |
| 2015 | 4.43 |
| 2016 | 4.17 |
| 2017 | 4.67 |
| 2018 | 4.66 |
| 2019 | 4.19 |
| 2020 | 3.74 |
Here is a graph of these figures alongside graphs for the previous two 14 year periods, back to 1979.
Sadly we do not have comparable data on Arctic Sea Ice minima around 1945, 1930, 1910, the Medieval Warm Period, or the Roman Warm Period.