Street Lighting – Update

It now turns out that Essex county Council have decide that it is just too difficult to have the lights back on in some places but not in others. In reply to a letter from Neil Stock (Con), leader of Tendring District Council, David Finch (Con), leader of Essex County Coucil, writes that this would be “administratively costly and unworkable”. You can see the full letter here – D Finch Response re Street Lighting – 17 Dec 15

Finally, when pressed to commit to a figure Cllr Finch tells us that it will cost £128,599.87 in the first year to keep the lights on, with no guarantee that this figure will not rise in future years. You can see the letter from Cllr Finch setting this out here – D Finch Response re Part Night Lighting – 4 Jan 16 .

I realise that, whilst Essex county Council have a legal responsibility to provide street lighting, the level at which this must be done is not closely defined. So, they [probably] have a legal right to turn off the light between 1:00am and 5:00am. However, to say that this has to be done for the whole of Tendring, because of the admin involved, is feeble beyond words. And then to pass on a bill for £130k pa to Tendring is more than my sense of humour is able to handle.

Now, there is something that you can do about this, You do not have to wait until 2019 when the next Tendring District Council elections are held. You get to vote for Essex County councillors in May 2017. Sadly not in this year. So, please make a note in your diary, tie a knot in your handkerchief, or whatever method you use. Just be sure that you do not vote these muppets back in for another term. Resolve now to never, never again vote Conservative.

Local Plan – The Mess Continues

Update:- I have now received this from the Senior Democratic Service Officer at Tendring District Council, “the meeting of that [Local Plan] Committee due to have been held on Thursday 10 March 2016 has been cancelled as there is no business to be transacted. There is no other scheduled meeting of the Committee in this current municipal year”. Really! Having pressed ahead with a housing figure that is too high, they now plan to assemble the Local Plan with no democratic oversight at all. Flabbergasted, doesn’t get close.

Thank you to all those who attended the meeting of the Local Plan Committee on Thursday night.

Sadly, the Country Club that currently runs Tendring District Council (Conservatives and their not so independent friends) pressed ahead and approved a figure of 550 dwellings per annum (dpa). That is 550 new houses to be built in Tendring, every year until 2032, or 9,350 new houses over the 17 year period. This is an improvement over the 705dpa, or 11,985 new houses originally proposed by the Conservatives. UKIP can take enormous credit for dragging the Country Club even this far.

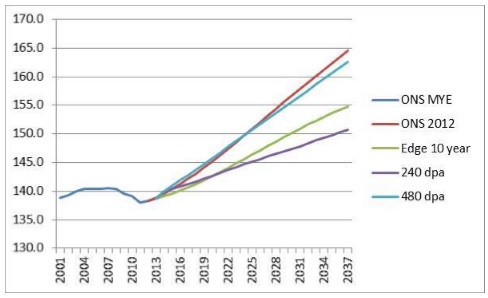
However, it is still the wrong number . I did propose an amendment that read as follows: “That recommendations b) & c) be replaced with the following: b) recognises that there remain substantial reasons to believe that a figure below 480 dpa is the appropriate Objectively Assessed Housing Needs figure for Tendring District Council; and c) approves for Development Management purposes that the Objectively Assessed Needs be set at 480 dpa whilst officers continue to identify the correct figure, including delivering against resolution 22.b) at the Local Plan Committee meeting held on 12th Nov 2015.” The public present were kind enough to support my contribution with a warm round of applause.

Councillors voting against this amendment, and in favour of the 550 figure, were: Cllr Tom Howard (Con, Beaumont and Thorpe), Cllr Carlo Guclielmi (Con, Manningtree, Mistley, Little Bentley and Tendring), Cllr Andy Baker (Con, Lawford), Cllr Mark Platt (Con, Hamford), Cllr Daniel Land (Con, Beaumont and Thorpe), Cllr Mick Skeels Senior (Coastal Independent, St Johns), Cllr Neil Stock (Con, Ardleigh and Little Bromley), Cllr Nick Turner (Con, Frinton). Cllr Gary Scott (Lib Dem, Alresford) abstained and Cllr Mike Talbot (Independent, St Osyth and Point Clear) arrived after this vote was taken. We are where we are because Tendring did vote for a Conservative lead administration. If we wish to avoid this kind of mistake in the future the residents of Tendring have it in their own hands – they simply have to stop voting for the Conservatives and their [not very] Independent friends.

One other point of interest at this meeting was the award of £640k from central government to Tendring, Colchester and Braintree district councils, along with Essex County Council, to evaluate the possibility of building and entirely new “Garden City” in this general area. I have not had a detailed briefing, but I understand there are four lead candidates. Possibly the front runner at this stage is a development on the borders of Colchester and Tendring, centred on Essex university. Clearly major investment in infrastructure would be needed. Without seeing any detail it is not possible to be for or against at this stage, but it is at least possible that such a development could be beneficial to Tendring.


Please come to Local Plan committee meeting this Thursday!

The next meeting of your Local Plan Committee is this Thursday at the council offices in Weeley (Thorpe Road, Weeley, CO16 9AJ) starting at 18:00 (6:00pm). The reason for making this special appeal is that I fear the Country Club majority on the committee (Conservatives and their [not very independent] Independent friends) are planning to force through a draft Local Plan that contains a figure for new houses that is OBVIOUSLY TOO HIGH. It would be excellent if a lot of residents came and made their views known.

In this endeavour they are being ably assisted by the officer responsible for the development of the local plan is Simon Meecham. He is not a Tendring resident and is not directly employed by Tendring District Council. He is a director of Paradigm Planning and Economics who has been employed as a consultant. He will be gone the moment a local plan is approved. For those with the interest you can see what Mr Meecham says about himself on his LinkedIn Profile . In my view, he has an interest in getting a plan in place, but no interest in getting the right plan in place.


Hollis 2016 01The heart of the problem is this graph. We are currently being presented with a population forecast for Tendring that rises sharply from now until 2037, despite the fact that the population has been flat from 2001 until now. The forecast driving the plan is the blue one entitled 480 dpa (not quite the highest forecast on this graph), which translates into a requirement for Tendring to build 550 houses per year; once ugly, but possibly unavoidable, add-ons have been added on.

I have written to Mr Meecham, copied to all the members of the Local Plan committee, about this and you may read that letter by clicking on this link Local Plan eMail 2016 01. You might click on the link just to get a clearer look at the graph.

Local Plan – 550dpa?

At short notice, on Thursday 17th December there was another presentation to councillors by John Hollis, on behalf of Peter Brett Associates, of a further revision to the Objectively Assessed Housing Needs (OAHN) figure for Tendring. Their original figure was 705 dwellings per annum (dpa), which had previously been reduced to 597dpa. During this presentation the reduced this number further to 550dpa (actually chosen as  mid-point in a range from 480-600dpa). In terms of headline numbers over the 17 year plan period these figures amount to; 11,985, 10,149 and 9,350 houses. This is a [small] step in the right direction, but it is still the WRONG number.

For those of you with the will to go through these things the presentation may be found here John Hollis Nov 2015. John Hollis is now retired, but remains quite possibly the most eminent demographer in the country. He is demographer royalty!

In this presentation you will find, on slide 10 ,that John Hollis has corrected for the Unattributable Population Change (UPC). However, we still do not kinow what calculations he performed to do this.

For those not familiar with this subject the UPC is the “missing” people in the 2011 census. Based on the 2001 census the demographers worked out how many people should be in Tendring over the following years. Yet when the 2011 census results came in there were the same number of people in Tendring as in 2001, rather than the 10,500 increase that the demographers had projected. The UPC is a negative 10,500 – which is huge. The total population of Tendring is around 138,000.

The central mystery of this whole local process is how a flat population trend, as show by the 2001 and 2011 censuses, has morphed into a rising population once Peter Brett have finished their work. The actual calculations need to be reviewed, and quite possibly the total fertility rate (TFR) used.

I have heard third hand that a TFR of 2.3 has actually been used. That would be ridiculous as the national TFR is only about 2.1. And it is as high as it is only because immigrants have a higher TFR, at around 2.3. The non-immigrant TFR is around 1.9. As a matter of FACT there are very few immigrants in Tendring.

The last local plan committee meeting passed a resolution requiring the officers to provide the calculations that are driving the dwellings per annum figures. The minutes may be found at Local Plan Committee Minutes Nov 2015 Look at the bottom of section 22.

Without sight of the calculations, we are sadly none the wiser. I will continue to press for that to happen.

Global Warming

Update – Please do look at this 5min video from a co-founder of Greenpeace: http://prageruniversity.com/Environmental-Science/What-They-Havent-Told-You-about-Climate-Change.html#.Vc4sj_lViko

Happy New Year to you all!

I realise global Warming is not a Tendring Specific issue. However, it is a special interest of mine and I was recently challenged to show where it get my information from. Having done this piece of work, I thought I would share it more widely.

Atmospheric CO2 comes from http://www.esrl.noaa.gov/gmd/ccgg/trends/. This comes from an observatory on Mauna Loa and does suffer from the problem that there is significant human intervention. I gather 85% of the data points recorded are manually rejected. Nonetheless, I am not aware that anyone is challenging rise from c1950 to the current day from about 0.3% to about 0.4% (ie about 33%). This dataset is seasonal. Though presumably a global figure would not be. The trend is pretty much a straight line – slight upward curve. Whether it is man-made or not is another question, though presumably the burning of fossil fuels and cutting down of rain forest must have some effect.

Polar ice extent comes from http://nsidc.org/data/seaice_index/ – One tab for the Arctic and another for the Antarctic. The Antarctic graph shows steady growth of about 0.5-1.0% per decade. The Arctic graph shows a decline of 4-5% per decade. However, that is to take a trend through two inflections. Arctic ice is actually fairly stable up to the mid-1990’s, then it falls through to the early/mid 2000’s and is flat since then. 2006 is the low point and the 2015 minimum was the 6th lowest on record. The fall from pre-1990 levels to post-2010 levels was about 1m Km2 in a total of around 11m Km2 (ie about 10%). There is more polar ice now than there was a decade ago, but 10% less than there was 30 years ago.

Note:- Polar ice extent is from satellite data, with minimal human intervention.

Global temperatures come from http://nsidc.org/data/seaice_index/. The one to look for is Global TLT. TLT is Temperature Lower Troposphere, the troposphere is the 15-20 Km above the surface of the earth. So the lower troposphere is the bit in touch with the earth. This shows stable temperatures through to the early 1990’s, then it rises through to 1998 and is flat since then. The rise from pre-1990 levels to post 2000 levels is around 0.4oC. The fall in arctic ice lags the rise in temperature by about five years.

Note:- This global temperature info is from satellite data with minimal human intervention. I have previously used http://www.metoffice.gov.uk/hadobs/hadcrut3/diagnostics/comparison.html but that requires significant intervention by people who are paid by the global warming lobby.

I have no source for sea level rises – because sea levels are not rising! I know of no credible source for any evidence of sea level rises. There are sporadic reports of islands in the Ganges delta being lost or Pacific islands inundated. However, if these are not from fanciful researchers, they will be down to erosion or changes in land level. If there is a global rise in sea levels, then it will be happening worldwide – that is the nature of water (and indeed worldwide).

Will the world succeed in keeping temperatures to less than 2oC above pre-industrial levels? Of course – our glorious leaders would not be able to push temperatures above that level even if they tried!

It is such a shame that the environmental debate focuses on CO2 emissions rather than habitat conservation and species/genetic diversity.