When I looked at figures from the 2022 BEFU (Budget Economic and Fiscal Update) and the Financial Statements of the Government of New Zealand for the year ended 30 June 2021 I found that the extra government expenditure during Covid has been baked into every year into the future. This amounts to an extra $25bn per year of total Crown Expenditure, which compares with the actual figure for 2021 of $133bn – a 19% increase. This take government expenditure from 35.5% to 42.1% as a percentage of GDP.
| NZD bn | Change | |
| 2015 Actual | 93,064 | – |
| 2016 Actual | 95,137 | 2.2% |
| 2017 Actual | 99,007 | 4.1% |
| 2018 Actual | 104,014 | 5.1% |
| 2019 Actual | 111,376 | 7.1% |
| 2020 Actual | 138,916 | 24.7% |
| 2021 Actual | 133,722 | -3.7% |
| 2022 Budget | 154,887 | 15.8% |
| 2023 Budget | 158,528 | 2.4% |
| 2024 Budget | 163,508 | 3.1% |
| 2025 Budget | 167,872 | 2.7% |
| 2026 Budget | 177,254 | 5.6% |
One might have expected total Crown Expenditure to fall after Covid. After all the costs of the vaccination program and furlough do not continue. However, in New Zealand government expenditure continues as if these costs are to be incurred every year into the future. Below I graph what Total Crown Expenditure would have been with annual growth of 4.5%pa from 2019.
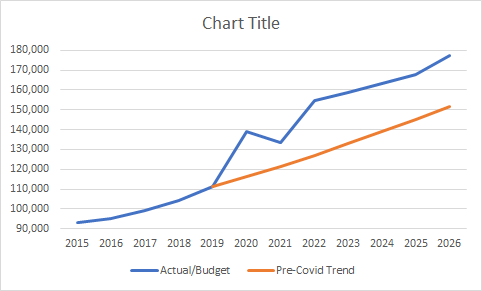
The government is making no attempt to return to the pre-Covid trend line. And there has been no attempt to explain what we are getting for this [massive] extra expenditure.