NZ Budget 2024

The last two year’s [Labour] budget figures from the relevant BEFU (Budget Economic and Fiscal Update) showed that the extra government expenditure during Covid had been baked into every year into the future. This year’s budget, from the 2024 BEFU (Budget Economic and Fiscal Update) does, very slowly, begin to close that gap, although the figures in the first year are actually worse.

The graph below shows actual/budget expenditure (Blue) compared to what it would have been with a 4.5%pa growth rate from the pre-Covid trend (Orange). The last Labour budget is shown in Grey. A 4.5% growth on the pre-Covid trend is extremely generous – no NZ government could reasonably expect the economy to grow at 4.5% indefinitely!

The bottom line here is that government expenditure is roughly 5% higher, as a percentage of GDP, than it was pre-Covid. And the current government has not laid out a plan to return to pre-Covid expenditure levels. The government may well point to; the poor state of the government books, the poor economic outlook, and the uncertain global economic position, as reasons not to reduce government spending now. However, as it stands, this National government are doing as decent impersonation of previous National governments who talked a big game in opposition and then became “Continuity Labour” in office. New Zealanders deserve so much better.

Arctic Sea Ice 2024 Maximum

With Arctic ice having reached its Maximum for 2024, it is time for the annual update. My figures come from NSIDC https://nsidc.org/data/seaice_index.

In the last nineteen (19) years only four years had higher maximums.

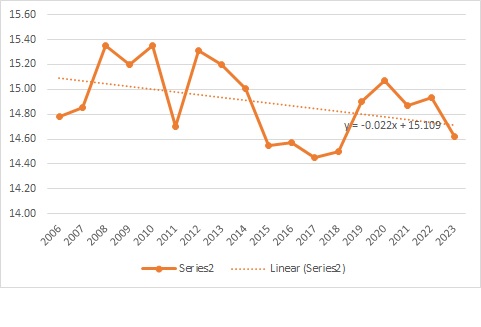
The last nineteen (19) years show the lowest annual arctic sea ice maximum in the satellite record (ie since 1979). However, the trend over the last nineteen years 2006 – 2024 is -0.11% per annum. If this trend continues arctic sea ice will decline by 0.11% in the next century. That seems to me to be as close to flat as makes no difference.

With the correct use of the english language present tense, the world IS not warming.

Figures for annual annual arctic ice sheet minima are:

 Year m Km2
2006
2007
2008
2009
2010
2011
2012
2013
2014
2015
2016
2017
2018
2109
2020
2021
2022
2023
2024
14.78
14.85
15.35
15.20
15.35
14.70
15.31
15.20
15.01
14.55
14.57
14.45
14.50
14.90
15.07
14.87
14.93
14.62
15.01

Here is a graph of these figures:

Arctic Sea Ice Minimum 2023

With Arctic ice having reached its Minimum for 2023, it is time for the annual update. My figures come from NSIDC https://nsidc.org/arcticseaicenews/.

2023 is the fifth lowest on record. That is to say that four years had LOWER winter sea ice minima than this year.

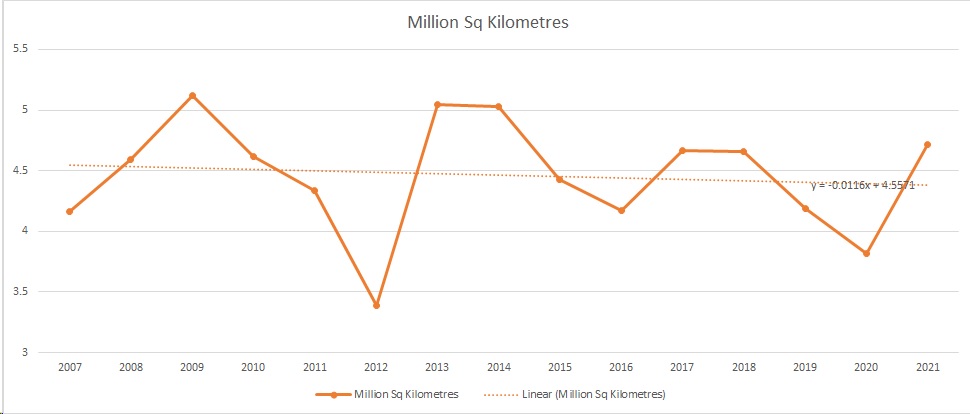
The last seventeen (17) years show the lowest annual arctic sea ice minimum in the satellite record (ie since 1979). However, the trend over the last sixteen years 2007 – 2023 is -0.9% per annum. That seems to me to be as close to flat as makes no difference.

With the correct use of the english language present tense, the world IS NOT warming.

Figures for annual minima are:

Arctic Ice Sheet Minima

 Year m Km2
20074.16
20084.59
20095.12
20104.62
20114.34
20123.39
20135.05
20145.03
20154.43
20164.17
20174.67
20184.66
20194.19
20203.82
20214.72
20224.67
20234.23

Here is a graph of these figures:

NZ Budget 2023

When I looked at last year’s budget figures, from the 2022 BEFU (Budget Economic and Fiscal Update) , I found that the extra government expenditure during Covid has been baked into every year into the future. This year’s budget, from the 2023 BEFU (Budget Economic and Fiscal Update) , continues that trend, only worse.

The graph below shows actual expenditure compared to what it would have been with a 4.5%pa growth rate from the pre-Covid trend. The government is making no attempt to return to the pre-Covid trend line.

The government chooses to represent numbers either as a percentage of GDP or in terms of net debt. Both these approaches have wriggle room for the government as the first allows them to use heroic GDP forecasts (over 5% every year), and the later allows them the change the way net debt is calculated.

The bottom line here is that we deserve to be told what we are getting for all this extra expenditure. That is not happening. New Zealander’s deserve so much better!

Arctic Sea Ice 2023 Maximum

With Arctic ice having reached its Maximum for 2023, it is time for the annual update. My figures come from NSIDC https://nsidc.org/data/seaice_index.

2023 is the fifth lowest on record. That is to say that four years had LOWER winter sea ice maxima that this year.

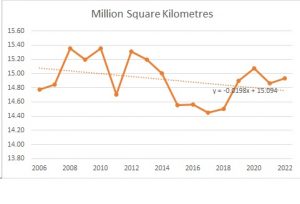
The last eighteen (18) years show the lowest annual arctic sea ice maximum in the satellite record (ie since 1979). However, the trend over the last sixteen years 2006 – 2023 is -0.15% per annum. That seems to me to be as close to flat as makes no difference.

With the correct use of the english language present tense, the world IS not warming.

Figures for annual annual arctic ice sheet minima are:

 Year m Km2
2006
2007
2008
2009
2010
2011
2012
2013
2014
2015
2016
2017
2018
2109
2020
2021
2022
2023
14.78
14.85
15.35
15.20
15.35
14.70
15.31
15.20
15.01
14.55
14.57
14.45
14.50
14.90
15.07
14.87
14.93
14.62

Here is a graph of these figures:

NZ Budget 2022

When I looked at figures from the 2022 BEFU (Budget Economic and Fiscal Update) and the Financial Statements of the Government of New Zealand for the year ended 30 June 2021 I found that the extra government expenditure during Covid has been baked into every year into the future. This amounts to an extra $25bn per year of total Crown Expenditure, which compares with the actual figure for 2021 of $133bn – a 19% increase. This take government expenditure from 35.5% to 42.1% as a percentage of GDP.

NZD bnChange
2015 Actual93,064
2016 Actual95,1372.2%
2017 Actual99,0074.1%
2018 Actual104,0145.1%
2019 Actual111,3767.1%
2020 Actual138,91624.7%
2021 Actual133,722-3.7%
2022 Budget154,88715.8%
2023 Budget158,5282.4%
2024 Budget163,5083.1%
2025 Budget167,8722.7%
2026 Budget177,2545.6%

One might have expected total Crown Expenditure to fall after Covid. After all the costs of the vaccination program and furlough do not continue. However, in New Zealand government expenditure continues as if these costs are to be incurred every year into the future. Below I graph what Total Crown Expenditure would have been with annual growth of 4.5%pa from 2019.

The government is making no attempt to return to the pre-Covid trend line. And there has been no attempt to explain what we are getting for this [massive] extra expenditure.

Arctic Sea Ice Minumum 2022

With Arctic ice having reached its Minimum for 2022, it is time for the annual update. My figures come from NSIDC https://nsidc.org/arcticseaicenews/.

2022 tied with 2010 as the eleventh lowest on record. That is to say that ten years had LOWER winter sea ice maxima that this year.

The last sixteen (16) years show the lowest annual arctic sea ice minimum in the satellite record (ie since 1979). However, the trend over the last sixteen years 2006 – 2022 is -0.05% per annum. That seems to me to be as close to flat as makes no difference.

With the correct use of the english language present tense, the world IS not warming.

Figures for annual minima are:

Arctic Ice Sheet Minima

 Year m Km2
20074.16
20084.59
20095.12
20104.62
20114.34
20123.39
20135.05
20145.03
20154.43
20164.17
20174.67
20184.66
20194.19
20203.82
20214.72
20224.67

Here is a graph of these figures:

Arctic Sea Ice 2022 Maximum

With Arctic ice having reached its Maximum for 2022, it is time for the annual update. My figures come from NSIDC https://nsidc.org/arcticseaicenews/.

2022 is the tenth lowest on record. That is to say that nine years had LOWER winter sea ice maxima that this year.

The last sixteen (16) years show the lowest annual arctic sea ice maximum in the satellite record (ie since 1979). However, the trend over the last sixteen years 2006 – 2022 is -0.13% per annum. That seems to me to be as close to flat as makes no difference.

With the correct use of the english language present tense, the world IS not warming.

Figures for annual minima are:

Arctic Ice Sheet Minima

 Year  m Km2
2006 14.78
2007 14.85
2008 15.35
2009 15.20
2010 15.35
2011 14.70
2012 15.31
2013 15.20
2014 15.01
2015 14.55
2016 14.57
2017 14.45
2018 14.50
2019 14.90
2020 15.07
2021 14.87
2022 14.93

Here is a graph of these figures:

Actic Sea Ice 2021 Update

With Arctic ice having reached its September minimum, it is time for the annual update. My figures come from NSIDC https://nsidc.org/arcticseaicenews/

The last fifteen (15) years show the lowest annual arctic sea ice minima in the satellite record (ie since 1979). However,the trend over these years 2007 – 2021 is -0.26% per annum. That seems to me to be as close to flat as makes no difference. The only years, in the last 15 years, with higher sea ice minima were 2009, 2013 and 2014.

With the correct use of the english language present tense, the world IS not warming.

Figures for annual minima are:

Arctic Ice Sheet Minima

 Year  m Km2
2007 4.16
2008 4.59
2009 5.12
2010 4.62
2011 4.34
2012 3.39
2013 5.05
2014 5.03
2015 4.43
2016 4.17
2017 4.67
2018 4.66
2019 4.19
2020 3.82
2021 4.72

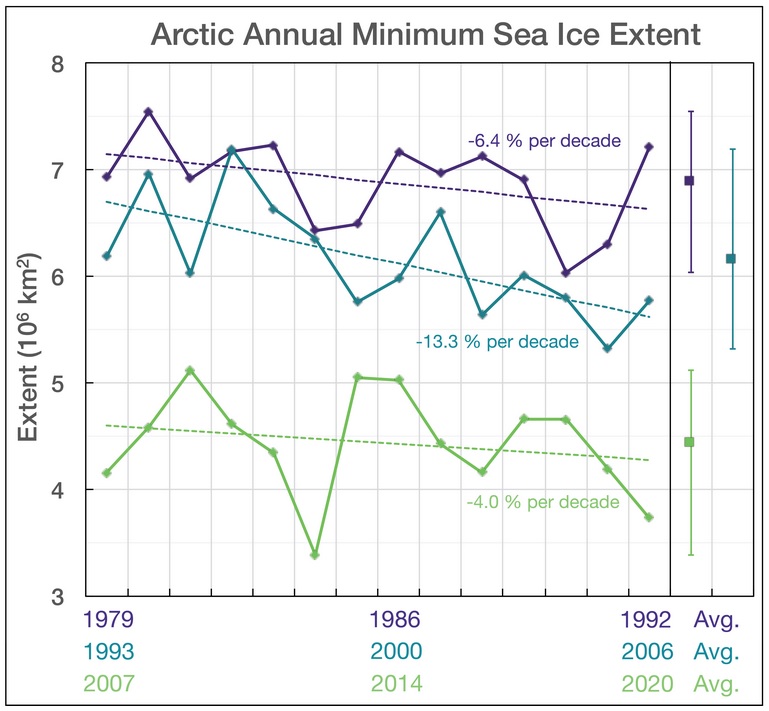
Here is a graph of these figures alongside graphs for the previous two 14 year periods, back to 1979.

Arctic Sea Ice 2020

With Arctic ice having reached its September minimum, it is time for the annual update. My figures come from NSIDC https://nsidc.org/arcticseaicenews/

The last fourteen (14) years show the lowest annual arctic sea ice minima in the satellite record (ie since 1979). The trend over these years 2007 – 2020 is -0.4% per annum. That seems to me to be as close to flat as makes no difference, but you may differ.

Figures for annual minima are:

Arctic Ice Sheet Minima

 Year  m Km2
2007 4.16
2008 4.59
2009 5.12
2010 4.62
2011 4.34
2012 3.39
2013 5.05
2014 5.03
2015 4.43
2016 4.17
2017 4.67
2018 4.66
2019 4.19
2020 3.74

Here is a graph of these figures alongside graphs for the previous two 14 year periods, back to 1979.

Sadly we do not have comparable data on Arctic Sea Ice minima around 1945, 1930, 1910, the Medieval Warm Period, or the Roman Warm Period.