Arctic Sea Ice 2020

With Arctic ice having reached its September minimum, it is time for the annual update. My figures come from NSIDC https://nsidc.org/arcticseaicenews/

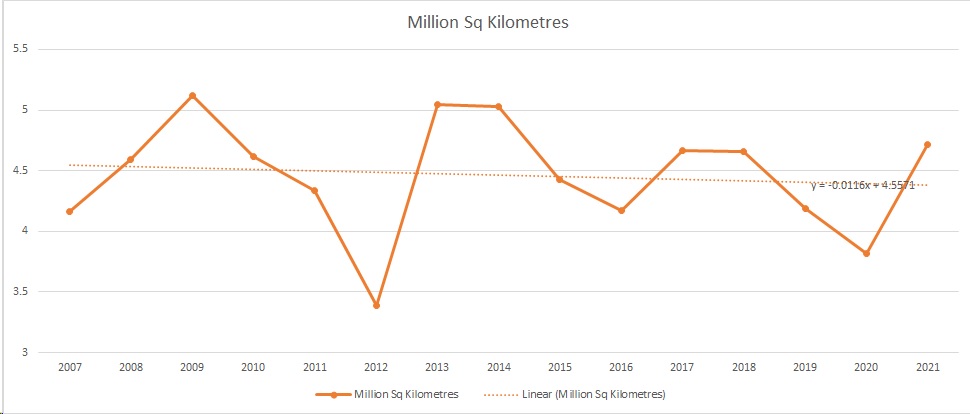
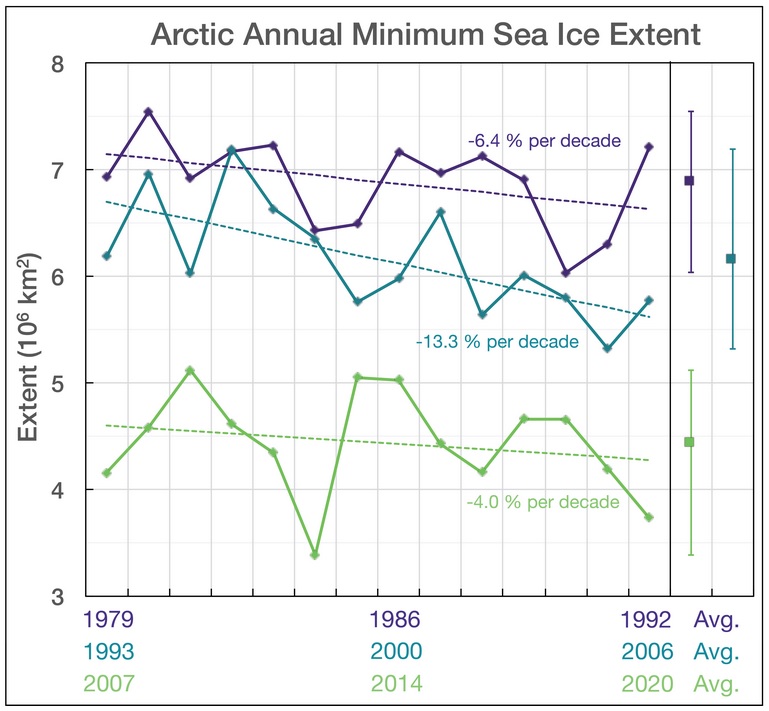
The last fourteen (14) years show the lowest annual arctic sea ice minima in the satellite record (ie since 1979). The trend over these years 2007 – 2020 is -0.4% per annum. That seems to me to be as close to flat as makes no difference, but you may differ.

Figures for annual minima are:

Arctic Ice Sheet Minima

 Year  m Km2
2007 4.16
2008 4.59
2009 5.12
2010 4.62
2011 4.34
2012 3.39
2013 5.05
2014 5.03
2015 4.43
2016 4.17
2017 4.67
2018 4.66
2019 4.19
2020 3.74

Here is a graph of these figures alongside graphs for the previous two 14 year periods, back to 1979.

Sadly we do not have comparable data on Arctic Sea Ice minima around 1945, 1930, 1910, the Medieval Warm Period, or the Roman Warm Period.

Nelson Future Access Project

https://www.nzta.govt.nz/projects/nelson-future-access-project

This is a vision thing! At this point the government has not made funds available to actually build any of these options, or indeed any other roading project in the South Island. The expectation is that the chosen project might be built in some 15 years time.

A Rocks Road walking and cycling facility, including a new seawall, is included in each of the three packages. The Coastal Corridor Widening Package would involve building the seawall two lanes further out.

The success criteria for this project do NOT include “reduced” travel times. Though not specifically excluded by legislation, guidance from this government has ruled that NZTA cannot take this objective into account. What NZTA can take into account is the achievement of more “predictable” travel times.

The number of journeys within the project area are forecast to increase from 100,000 to 140,000 per day by 2048. This is in line with the “High Growth” scenario used in the Nelson-Tasman Future Development Strategy, which has population of Nelson/Tasman growing from 104,000 in 2018 to 145,000 in 2048. This compares to 2048 population figures of 105,000 in the low growth strategy and 120,000 in the mid-point/most likely scenario. It is not clear why NZTA have used the high growth forecasts. However, this is a “differential” exercise (a choice between options) on a common basis, so in many ways it does not matter. And, when it comes to a final choice we will doubtless have updated forecasts anyway.


Spoiler alert!

I am going to choose the widening of Rocks Road to two lanes each way.


Priority Lanes:

When it comes to safe, efficient, resilient movement of people and goods in an improved urban environment, there really is nothing to beat “priority lanes”. These are lanes reserved during peak traffic hours for certain vehicles, usually including some or all of the following; buses, taxis, goods vehicles, multi-occupancy vehicles. The priority lanes have to be rigorously enforced – just one parked car and the whole thing snarls up. So in Leeds in the UK they have used forklifts to unceremoniously remove offending vehicles!

Enforcement of priority lanes will be done primarily by cameras. Apart from buses, each of the priority categories above have their own enforcement issues:

  • Taxis would presumably include Uber and/or Ola which are indistinguishable in appearance from a private car. Will the camera system have to be linked to a taxi number plate registration system? Would any private hire cars have to use the non-priority lanes unless pre-registered?
  • Would a goods vehicle be allowed in the priority lane only when it is being used for work purposes, which is hard to enforce? Otherwise this seems to encourage a person popping into town on a private journey to take the, presumably larger, work vehicle.
  • Multi-occupancy vehicles would either be minimum three people (T3) or two people (T2). Clearly T3 is more efficient but a camera can really only identify if there is a person in each of the front seats. So, do we have to accept T2 for enforcement practicality?

Whilst the consultation document mentions priority lanes it remains coy about just what they would entail. What is clear is that the Inland Route Package using the old railway alignment, essentially a new road, is not compatible with the priority lanes concept, because this new road is only one lane in each direction. For this reason alone I rule this option out. The lady from Wellington NZTA who was manning the information centre at the Nelson market on Sunday 11th July (Carol Aldridge) did suggest that this road could be single use for busses during peak times, but that really doesn’t work. It is one thing to slide over and use the priority lane when other cars doing so reminds you that this is acceptable at the time you are travelling; and quite another to chose an entirely different route because you know that this option is available. Also, local residents will presumably have to be allowed to use the road at all times, and administering a scheme to correctly identify cars properly owned by residents within a fairly designated area is not a trivial challenge.


Parking:

Turning a road that is one lane each way into a road that is two lanes each way and rigorously enforcing priority lanes involves the loss of considerable amounts of existing on-road parking. It is conceivable that you could allow parking at non-peak times during the day, but in reality this is inconsistent with effective priority lanes. So you would end up with parking overnight only (maybe 7:00pm until 6:00am), which is of limited use to most people.

The loss of parking is far greater for the Waimea Road alignment (Priority Lanes Package) than the Rocks Road alignment (Coastal Corridor Widening Package), simply because there is so little parking currently along the Rocks Road section of the latter. The loss of parking per kilometre along the section of SH6 from Tahunanui to the Annesbrook Drive Roundabout (near Mitre 10 Mega) has to be about the same as along the entire Waimea Road alignment.

For this reason alone the Coastal Corridor Widening Package is preferred over the Priority Lanes Package.


Another reason to choose the Coastal Corridor Widening Package?

When visitors to Nelson arrive by air, the Coastal Route into the CBD along Rocks road is a stunning introduction to the area; with views across the Tasman bay to Kahurangi and Abel Tasman National Parks. We’ve got it so let’s flaunt it!

In due course it seems inevitable that the runway at Nelson airport will be extended to accommodate larger aircraft, which would seem to signal the end for the golf course. I believe the airport already owns the land that the golf course is on. That in turn might allow for an even more spectacular route to the CDB along the alignment of Golf Road and Beach Road, which is not compatible with a choice of Waimea road in this consultation.


What about sea level rise?

I am a sceptic about sea level rise. Measuring it is fraught with difficulty, not least that the land keeps moving, especially in New Zealand. In this instance we are really only concerned about sea level rise/fall relative to the land. And we have Tide Gauges for that. These give a Vertical Land Motion (VLM) of up to 1mm/year. I am unable to get definitive data on Nelson and can only offer this https://agupubs.onlinelibrary.wiley.com/doi/full/10.1029/2019JB018055 to show that the land in New Zealand is rising at a rate that is at least a fast as any of the doomsday seal level rise predictions. The only part of New Zealand that is falling on a geological timescale is Thames. And you may remember that in the Kaikoura earthquake the land rose some two metres! We should definitely ask the Geology Department of the University of Otago for figures on land rise in Nelson over the last century.


Intersections:

Choosing the Coastal Corridor Widening Package does raise the issue of the traffic lights in Tahunanui! If a widened SH6 is going to go through this junction then some kind of over/under-pass is going to be necessary at some point. The same would be true of the; multiple traffic lights on Rutherford Street, the lights near Nelson Hospital, and the Whakatu Drive roundabout, if the Waimea Road alignment was chosen.

NZTA (Carol at the information tent) says that the choice in front of us does not make any calls on future intersection improvements. Indeed, all of these may seem rather minor compared to the decisions that will have to be made about the traffic lights at the Lower Queen Street intersection in Richmond. Apparently NZTA have a different project looking at all these intersection challenges.


Metrics:

Please can we have some greater clarity over how the various options are being judged. How on earth did someone decide that the “Priority Lanes” option is only “Slightly positive compared to the status quo”? Apparently the Coastal Corridor Widening Package would “would reduce the traffic pressure along Waimea Road and there would be more reliable journey times into the city” but is rated as “No Benefit” on the “Nelson is more accessible” metric. And the Coastal Corridor Widening Package “would reduce the traffic pressure along Waimea Road” but is rated as “No Benefit” on “Quality urban environments” whatever that is. NZTA really can do so much better than this.


Other thoughts:

The consultation document makes no mention of taxi services such as Uber and Ola, which we would presumably with to encourage. Where should they wait when not on a call?

The consultation makes no mention of eScooter hire services such as Lime, Flamingo, and Jump. Will these be using car lanes, cycle lanes, or footpaths? And are these sized accordingly?

What about minibus on demand schemes such as this one in Germany https://www.kvgof.de/fahrplaene-und-linien/weitere-infos/hopper/. They might need to stop in priority lanes to pick up customers, which would be a complete no-no. So, do we create pick up / let down bays on the priority routes?


And finally:

Are we giving too much weight to the value of the “heritage chain fence” on Rocks Road? No doubt it is a wonderful thing, but does it really warrant the three references it gets in the consultation document. And if it really is of such value, presumably it could be moved?

Covid 19 and QuALYs

At its core the problem with the NZ government’s Covid-19 strategy is that they addressed themselves to a task that they were confident of addressing successfully, rather than the task that actually needed to be addressed. They are following a course of action that minimises deaths from Covid-19 in the short term, rather than maximising the health of all New Zealanders in the long run.

There are two particular consequences from this government’s chosen course of action. In both cases you need to understand the stupidity of focussing on “deaths” as your metric. Everybody dies! It is not whether a person dies that matters; but when they die, and the quality of life they have until they die.

Around the world public health bodies use the concept of Quality Adjusted Life Years (QuALYs) to decide whether to fund a particular treatment. [Please note this concept is not used subsequently when assessing whether to treat a specific patient.] When thinking about hip replacements, the logic would be something like this. The average person who might receive a hip replacement would have 20 years of life after the operation and their quality of life might be increased from 75% to 100% of a reasonable expectation of a full and healthy life at that age. So each operation would generate 5 QuALYs. In the UK some years ago the threshold was around £30,000 per QuALY (my memory may be faulty and these numbers are indicative only). So provided the hip replacement operation could be provided for less than £150,000 then UK NHS would fund hip replacements. Once a treatment has been accepted it remains on the list of NHS provided treatments, unless new clinical evidence calls this into question. How do Qualys relate to Covid?

First, by cancelling elective surgeries and out-patient appointments and laying off large numbers of General Practitioners NZ PHS prepared for an avalanche of Covid cases. However, this was at the expense of the service that NHS NZ normally provides. Given the pressure that NZ PHS is normally under, it is inconceivable that this “missed” care can be caught up. Patients not treated will find that their quality of life will be lower than it otherwise would be, and some of them will die earlier than they otherwise would have done. We will not know the names of these deaths, and they will not be reported at a daily press conference, but we can be sure that they do exist. And, of course, all the non-fatal outcomes will have adverse effects on the QuALYs experienced by those patients.

Second, economic activity is being severely restricted. This will affect health outcomes in two ways. First, it will lower money available to NZ PHS. So they will not be able to fund the cost per QuALY they might otherwise have been able to fund. If NZ PHS funds treatments costing less than $50,000 per QuALY today, then after the economic devastation being wrought by the government’s current actions NZ PHS might only be able to fund treatments costing less than $30,000 per QuALY. Second prosperity is directly linked to health outcomes. You only need to compare life expectancy in Fiji (70 years) with that in New Zealand (82 years). And, of course, during those years of life a person living in Fiji does not receive the same level of health care that is delivered in New Zealand. This results in lost QuALYs, particularly later in life (for instance not receiving a hip replacement in Fiji which does happen in New Zealand). Such economic differences are further exaggerated in the event of natural disasters. Fiji is struggling to cope with the effects of Cyclone Harold last week in a way the New Zealand did not struggle with the after-effects of cyclone Gita – Fijians would willingly accept a one way system on one hill in two year’s time as the only lasting consequence!

In handling Covid-19 New Zealand needed a government that levelled with us. This is a crisis, and flattening the curve is essential. However, it is a balance and this government has not even attempted to find that balance. The government should have told us that deaths from Covid were going to be part of the optimal solution. The government should have told us keeping the economy going as much as possible was part of the optimal solution. To ask whether a business was “essential”, in deciding whether to allow a business to operate, was to ask the wrong question. We should not be asking; Is a business essential? We should be asking; Can a business be carried on safely? Since Wuhan came out of lockdown New Zealand has been the country with the harshest economic shut down in the world. This is a difficult balance to strike – certainly challenging the experts to understand whether their forecasts were “worst” case or “central” case requires an intelligence and determination that would be uncomfortable for all involved. A government that is strong on pathos is poorly placed to do carry out this task. To deliver the best possible outcome from the Covid pandemic, New Zealand needed a government with intelligence, determination and courage. New Zealand will be suffering the consequences of this governments Covid-19 decisions for lifetimes to come.

Arctic Ice 2018

With Arctic ice having reached its September minimum, it is time for the annual update.

As for the previous eleven years, arctic sea ice continued to NOT shrink. The figures are:

Figures for annual minima are:

Arctic Ice Sheet Minima

 Year  m Km2
2007 4.16
2008 4.59
2009 5.12
2010 4.61
2011 4.34
2012 3.39
2013 5.05
2014 5.03
2015 4.43
2016 4.14
2017 4.64
2018 4.60

There is no trend here. You can inspect my graph here

Diversionary Tactics

Whenever Tony Blair was having a particularly tough time he would role out his old favourite – Fox Hunting. That was usually good for the headlines he needed to divert the news agenda from his problems. Jacinda Ardern clearly learnt a thing or two when she was working for Tony Blair.

The headline in the Guardian today is “New Zealand likely to become a republic in my lifetime, Jacinda Ardern says”. However, to the enormous credit of the New Zealand press it does not seem to have had the desired effect. There is no sign of New Zealand becoming a republic in the New Zealand press. On the contrary, Stuff leads with “Is Jacindamania Over?”.

To give you a flavour of the issues have a look here. Perhaps the most serious is Ardern’s decision to say with a straight face that there are no Russian spies in New Zealand, hence no deportations. This is in contrast to 25 other countries that seem to have had no difficulty identifying spies for expulsion at very short notice.

This is not an accident. Ardern did two big interviews last weekend covering the Skripal case, when she repeatedly described the poisonings as “repugnant” but never used the word “Russia” in either interview.

She may be right to hesitate over naming Russia. The US ambassador to New Zealand was asked if he was “certain” that Russia was responsible, twice, and failed to say “Yes” either time. It may be that Russia was in fact not responsible, but saying that you stand squarely beside your Five Eyes partners and then not standing squarely beside your Five Eyes partners looks a lot like the “cake and eat it” diplomacy that will only anger both the Russians and New Zealand’s friends.

Global Temperatures

Back in January 2017 I wrote that “2017 seems destined to be cooler than 2016“. How did that turn out?

Well, on the current MSU & AMSU Time Series data published by Remote Sensing Systems the average global temperature anomaly for 2017 was +0.634 oC and for 2016 it was +0.742 oC. Job done? Yes and no.

Sadly we can no longer trust the satellite record. The historic data has been “amended”, without explanation. When I reported the 2016 figures a year ago, the average temperature anomaly for 2016 was +0.573 oC. The temperature for 2016 has “risen” by 0.169 oC during 2017! My spreadsheet with the numbers is here.

The figures have been amended retrospectively each month by a small amount. The temperatures for 2017 are still rising month by month. Having amended the surface station record to re-write history the “scientists” now seem to be doing the same to the satellite record.

Here in New Zealand NIWA released their 2017 Annual Climate Summary, still using their flawed Seven-[ground] station series. This states that 2017 was the fifth warmest on record, and listing a series of temperature “highs”. You would be forgiven for thinking that temperatures were rising. The report hides the fact that, even on their own data, 2017 was much cooler than 2016 (+0.54 oC versus +0.80 oC).

Where to turn? A great deal of hope has to rest with Scott Pruit, Trump’s appointment to head the US Environmental Protection Agency (EPA). Maybe he can put the “science” back into “climate science”.

Capital

The Guardian recently reported on a report by the Institute for Public Policy Research (IPPR) which made the uncontentious statement that “The unequal ownership of capital in the economy is a powerful driver of inequality”. However, they then went on, not surprisingly, to propose ownership reform to: “give more people a share of capital, both as useable wealth and for its income returns; and to spread economic power and control in the economy”.

Is this not like using a sledge-hammer to crack a nut? I strongly suspect that if you ask employees, what they want is a pay rise rather than a share in the ownership. Sure, if they can sell that share then they are not averse to a quick handout. But the key is getting money into their bank account, rather than giving them power and control in the economy.

The report [rightly] extols the virtues of employee ownership trusts, cooperatives, and mutual. It also proposes a UK Sovereign Wealth Fund, which they call a Citizens Wealth Fund. Which is fine, though the UK government is not flush with the means to fund that idea just now. And has not had such funds for many decades.

Surely the key here is “income”. What if a more favourable tax regime existed for companies that gave a share of the profits to employees?

Shareholders might not like it, but remember that shareholders a generally not investors in a company. They buy shares off an existing shareholder, so the money they “invest” goes to the previous owner of those shares not to the company. And, returns on equity (ROE) have historically been high compared to other forms of saving. A McKinsey study found ROE to be 5.0% over 116 years. That is huge, and definitely leaves room for a more equitable sharing of profits whilst retaining the incentive to invest in productive assets.

Value in any business derives from; capital, labour and scarcity. Scarcity would be things like; mineral rights, technology, brand, intellectual property. It seems to me that the owners of capital are entitled to a return on their capital, but a return on the labour of their employees as well? In what way is it right that the owners of shares should have the right to claim 100% of the profits of a business?

Capitalism has definitely out-performed communism, but that was last century’s debate. In the 21st century the debate is about what form capitalism should take. The rules of capitalism are not fundamental laws of nature and should be open for review. In that, even if the IPPR over-reaches with suggestions on ownership, it is surely right to propose changes to the way that profit is shared.


Assisted Dying

David Seymour, the sole ACT MP in this New Zealand parliament, introduced his private member bill on assisted dying last Wednesday. It passed by 76 votes to 44. Two things caught my eye. One similarity to the UK. And one difference.

The difference is immediately apparent:- this is a suitable subject for parliamentary debate in New Zealand, but it is not even a subject of political discussion in the UK. This bill is very limited in scope. For instance it requires the informed consent of the person dying, and so does not attempt to provide the possibility of a dignified end to life for a person suffering from dementia. It is widely popular amongst the new Zealand Electorate.

The similarity only becomes apparent if you try and check how a particular MP voted. Here is the only record that I can find. In the UK it is also very difficult to find how your MP voted. In the modern age it would be trivial to have a page on the government website that shares this information with the electorate.

In a representative democracy, the people being represented clearly have a right to know their representatives vote in parliament. Why are MP’s in the UK and New Zealand so coy about how they vote?

Wolves

Jörg Urban, the head of the AfD group in the Saxony state parliament, has come up with one of the all-time great one-liners. He said that, if plans to halt lignite mining went through, Saxony would become “a new, regional poorhouse with no future, but a lot of wolves.” This is right up there with “super cali go ballistic Celtic are atrocious“.

This stems from the convergence of two Green party policies. First, they support the return of Wolves in Lausatia, which is part of Saxony on the Polish border. Second, they plan to ban the mining of lignite (Brown Coal), of which Lausatia has the largest reserves in Germany.

Germany currently uses lignite for 24.4% of its energy production. Following Fukishima, Germany is planning to phase out nuclear which currently accounts for 11.5% of Germany’s energy production. Having its energy mix meet its COPO23 target of reducing Germany’s greenhouse gas emissions by 40 percent by 2030, relative to the 1990 levels, makes the current coalition negotiations look like child’s play.

The AfD solution is, rightly, to ignore the CO2 emissions. The world continues to prove, to the dismay of Greenies everywhere, that CO2 levels in the atmosphere have no significant effect on global temperatures. Support for COP targets is just the sort of virtue signalling that the better off in society can afford.

What is so delicious about the statement from Jörg Urban is that, for the first time, it depicts the green electorate as a pack of wolves preying on the poorer in society. As with the wolves, we may find this is an image that has legs.


Rat Alert

A single piece of excrement, just over an inch long, has sparked a major alert in New Zealand. The reason:- It could be rat poo. And:- it was found on Codfish Island.

Codfish Island is one of three islands where Kakapo survive in the wild, holding the majority of the 154 animals left alive. The Kakapo is a large flightless parrot that has been driven to the verge of extinction by introduced predators, including rats. These three islands are, or at least were thought to be , and were intended to be, predator free.

There is a rather brutal view that the Kakapo is the avian version of the Giant Panda. Which is to say that it seems to have a kind of evolutionary death wish, so spectacularly ill-suited is it for survival. If there were Darwin Awards for animals, these would be two contenders. However; they are important both in their own right, and as indicators for the ecosystems they live in, and as indicators of mankind’s will and ability to conserve the precious genetic diversity of planet earth.

There is a vision of making New Zealand “predator-free” by 2020. What chance of that happening, if we cannot even keep codfish island predator-free? Maybe we can take some comfort from the fact that in New Zealand an inch of possible rat poo is newsworthy.